Monitor API usage
Learn how to review your API usage with the API activity dashboard and API logs tool. Get an overview of recent calls made from your account, or modify filters to view subsets of your API activity data.
Monitor API activity
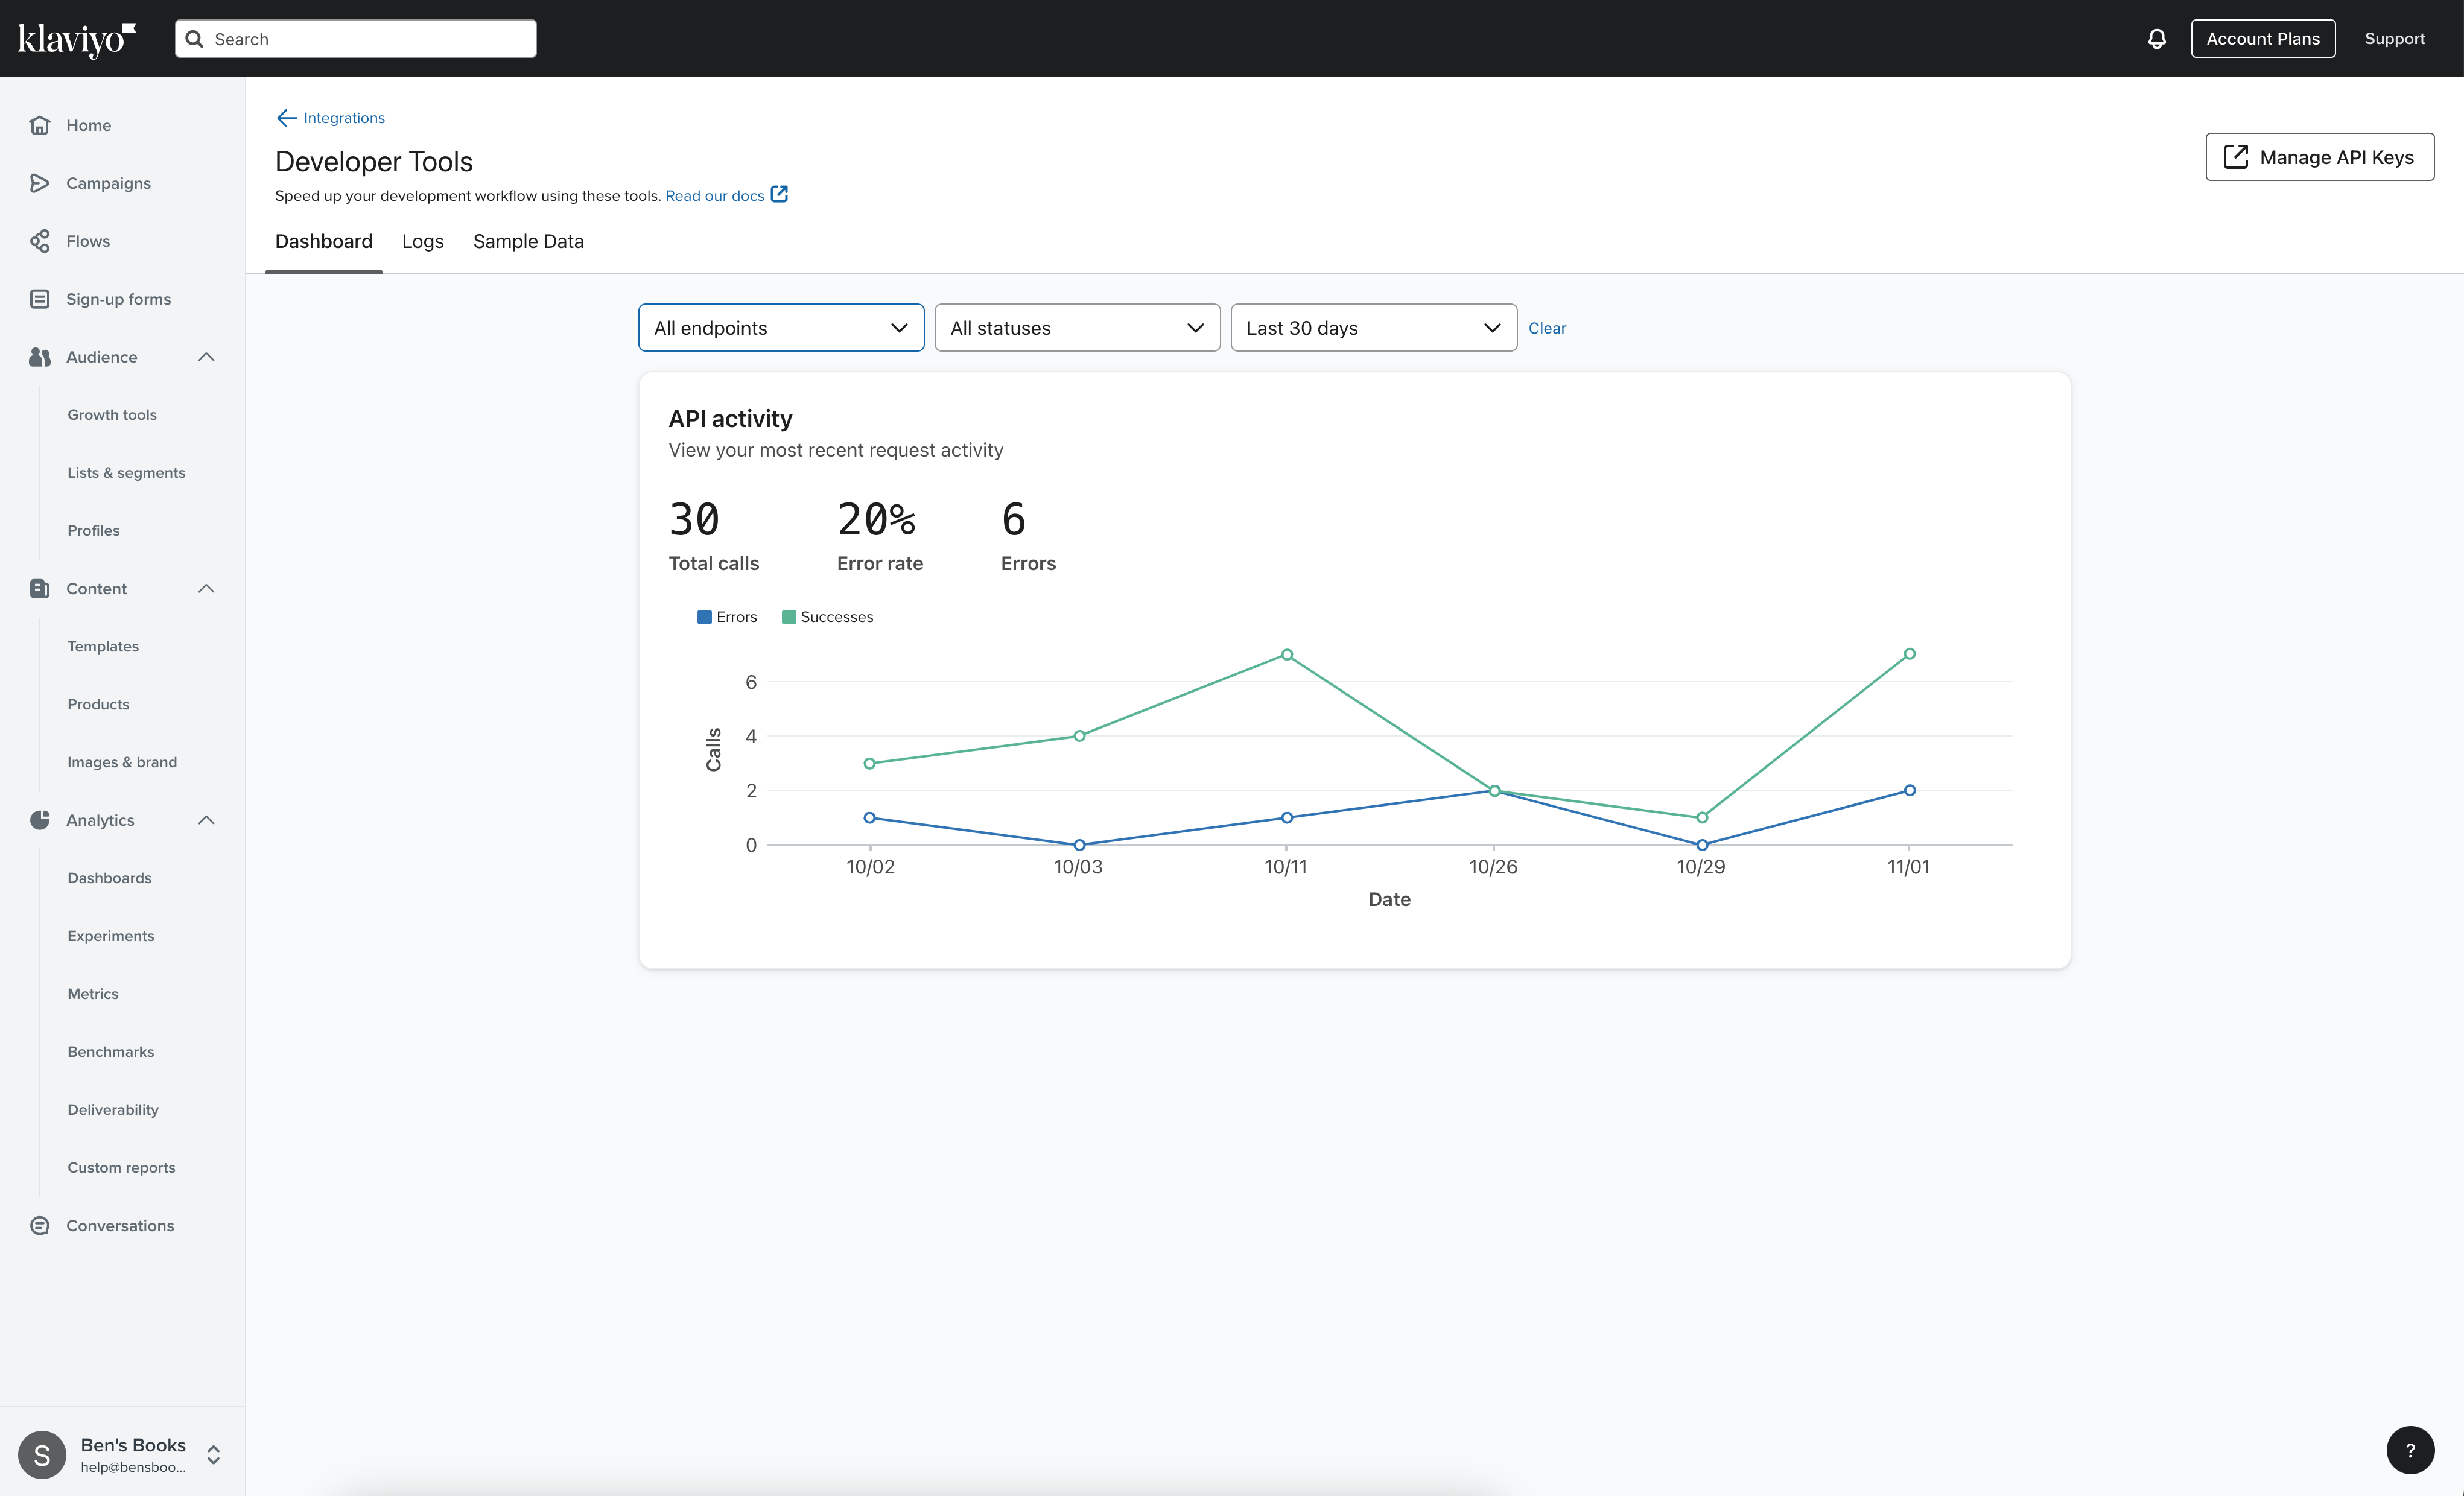
The API activity dashboard enables you to gain insights and track the long-term performance of your APIs. Effortlessly monitor high-level usage trends and stay informed about any ongoing issues.

Total calls
Displays the total number of API calls made from your account with the given filter criteria.
Error rate
The rate of errored calls out of total calls made.
Errors
Displays the total number of error statuses for API calls made from your account.
Filter criteria
The API activity dashboard can be filtered by endpoint, status, and time period.
If no available data matches the given criteria, the dashboard will display No Data Available. To reset your filter criteria to the default values, click Clear.
Endpoint
Results can be filtered by any individual endpoint. Legacy API endpoints are not included in this data set.
- All endpoints (default)
- Accounts
- Campaigns
- Catalogs
- Client
- Coupons
- Data privacy
- Events
- Flows
- Images
- Lists
- Metrics
- Profiles
- Segments
- Tags
- Templates
Status
Results can be filtered by the status of your API calls. For more information about what each code indicates and how to resolve errors, refer to the status codes and errors guide.
- All statuses (default)
- All success codes
- 200 - OK
- 201 - Created
- 202 - Accepted
- 204 - No content
- All failed codes
- All 4xx codes
- 400 - Bad request
- 401 - Not authorized
- 403 - Forbidden
- 404 - Not found
- 422 - Unprocessable entity
- 429 - Rate limit
- All 5xx codes
- 500 - Server error
- 502 - Service unavailable
Time period
Results can be filtered by the following time periods, based on your account’s current time zone:
- Today (default)
- Last 3 hours
- Last 3 days
- Last 7 days
- Last 30 days
- Last 90 days
- Last 24 hours
Review API logs
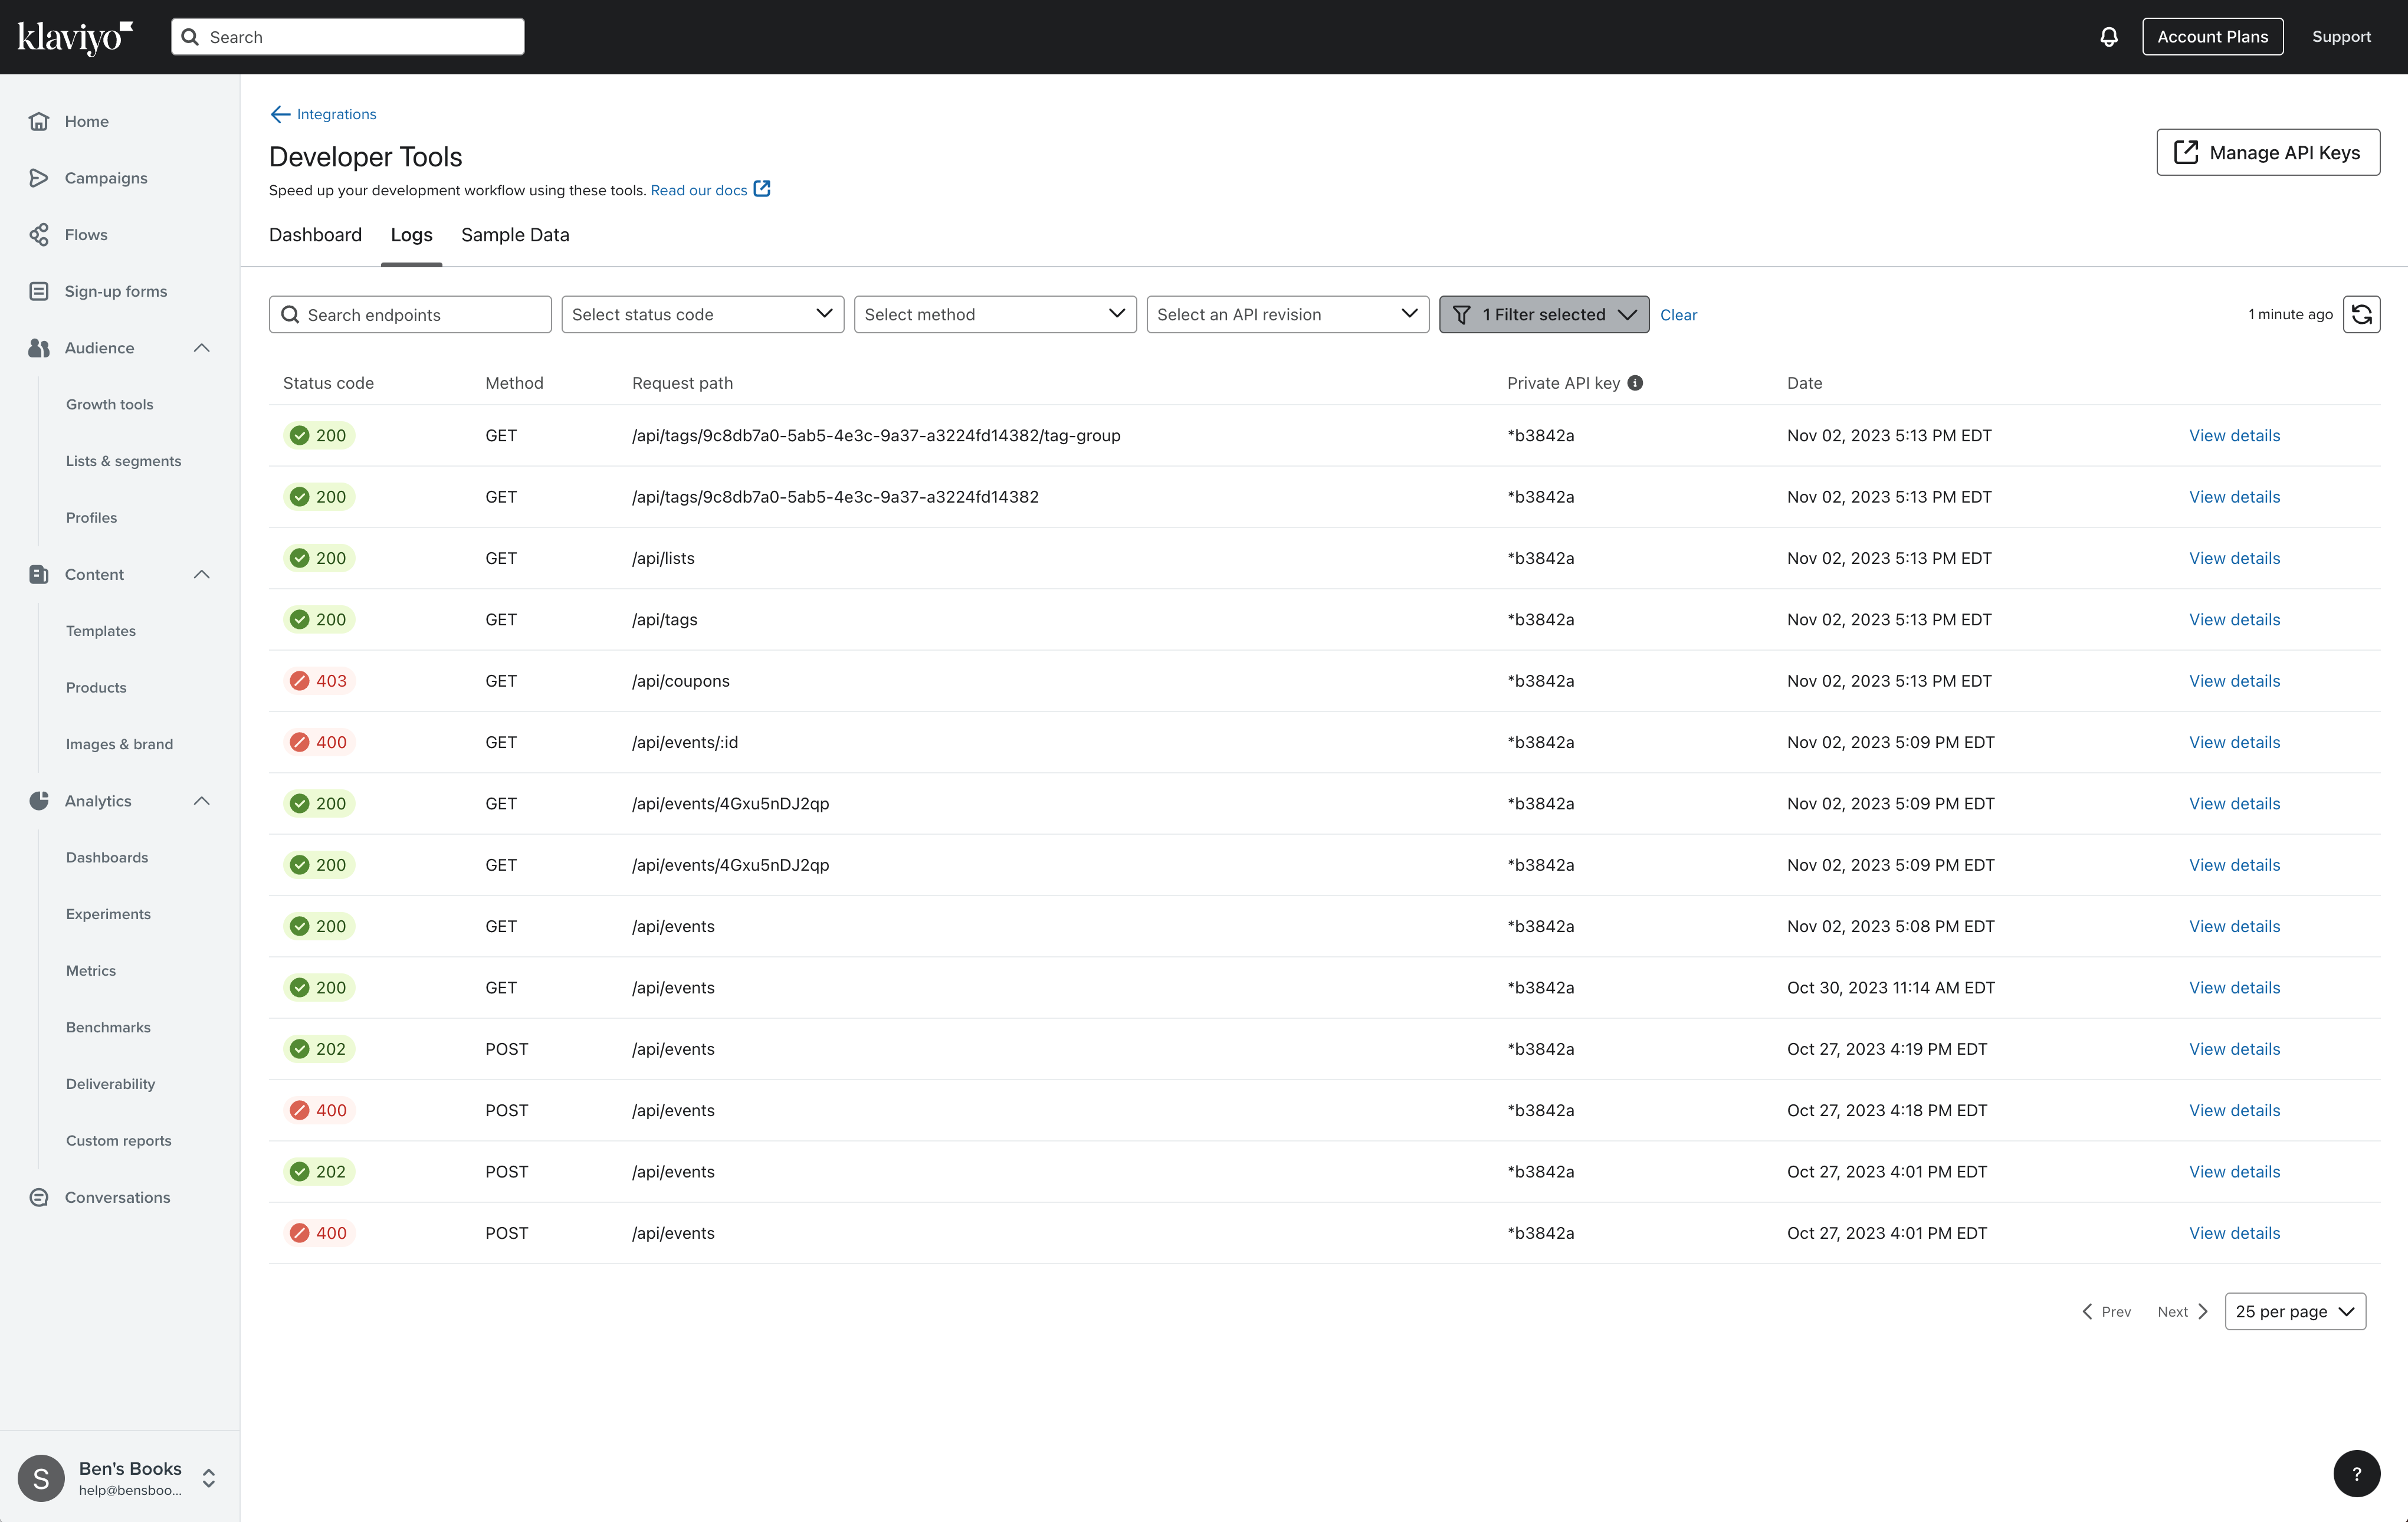
The API logs tool enables you to take a granular view of your API requests. The API logs tool displays recent API requests by status code, method, request path, private API key (truncated for security), and date.

Data retention
The API logs tool retains 14 days worth of API logs. API logs past this date will be unavailable, although the high-level aggregate information will continue to be stored in the API activity dashboard.
Filter criteria
The API logs can be filtered by status code, method, and API revision. In the additional filter variables, filter by time period, a specified job, trace, or error ID, and individual private API keys.
If no available data matches the given criteria, the dashboard will display No requests available. To reset your filter criteria to the default values, click Clear.
Search endpoints
Locate requests made to specific endpoints by pasting in the exact URL path of the endpoint, or wildcard an ID using brackets, such as {id}.
Valid search examples:
/api/events- Returns all calls hitting that URL path/api/events/{id}- Returns all calls hitting that URL path, with ID as a wildcard search/api/events/4Gxu5nDJ2qp- Returns all calls hitting that URL path for the exact given ID
Status code
Results can be filtered by the status of your API calls. For more information about what each code indicates and how to resolve errors, refer to the status codes and errors guide.
- All success codes
- 200 - OK
- 201 - Created
- 202 - Accepted
- 204 - No content
- All failed codes
- All 4xx codes
- 400 - Bad request
- 401 - Not authorized
- 403 - Forbidden
- 404 - Not found
- 422 - Unprocessable entity
- 429 - Rate limit
- All 5xx codes
- 500 - Server error
- 502 - Service unavailable
Method
Filter your results by the HTTP method used to make the request.
- GET
- POST
- PUT
- PATCH
- DELETE
API revision
Search for requests made using a specific API revision. The current Stable and Beta revisions are marked with a label indicating the latest releases.
Updated over 2 years ago